Tenderloin - Tender Spot for Crime?
Introduction
San Francisco (SF) is one of the cities in the USA with the highest crime rates. Particularly in the small district, Tenderloin, the sheer amount of crimes per year is shocking.
Thanks to technological evolution, a newborn predictive policy has taken place in the data science sector. The implementation of huge crime databases allow law enforcement and researchers to adapt a better overview of “crime hot spots” and analyze the historical evolution of crimes.
In this article we explore the crime history from 2003 to 2017 of the poorest district of San Francisco: Tenderloin. A district that is “infamous for drugs, homelessness and crime”
We have access to a publicly available dataset from SF OpenData consisting of crimes from 2003 to 2017 over all of SF categorized by crime-type, location, time of incident, and much more. The dataset has more than 2 million incidents covered.
Tenderloin - the “peak” of the city
Let us start by giving the reader the opportunity to explore the dataset themselves. In this visualization the reader is able to get an idea of the distribution of all the crimes-types in SF. In particular, it is encouraged to compare Tenderloin’s crime-density to any of the surrounding neighborhood districts, such as Southern, Northern and Central.
What is most peculiar is the consistency at which Tenderloin scores higher than the other districts. And, impressively more so, the drug crime density of Tenderloins is more than 20 times higher than the second highest scoring one (Southern). Indeed, as claimed by this article more than 85 percent of all drug-related arrests in SF happen in Tenderloin. (Although the article is from 2022)
So this is where the story leads us, into the enormous drug-market that exists in Tenderloin. The next questions to ask are: where in the Tenderloin does these drug incidents happen? Why particularly here? And are we seeing any changes over time?
Where, why and when?
According to wikipedia the street “Turk street” is particularly infested. In this next plot, we shall see how the distribution of drug-crimes varies inside Tenderloin. In addition, we show this visualization from 2008, where the drug-crimes were at its highest, till as recent time as possible (2017).
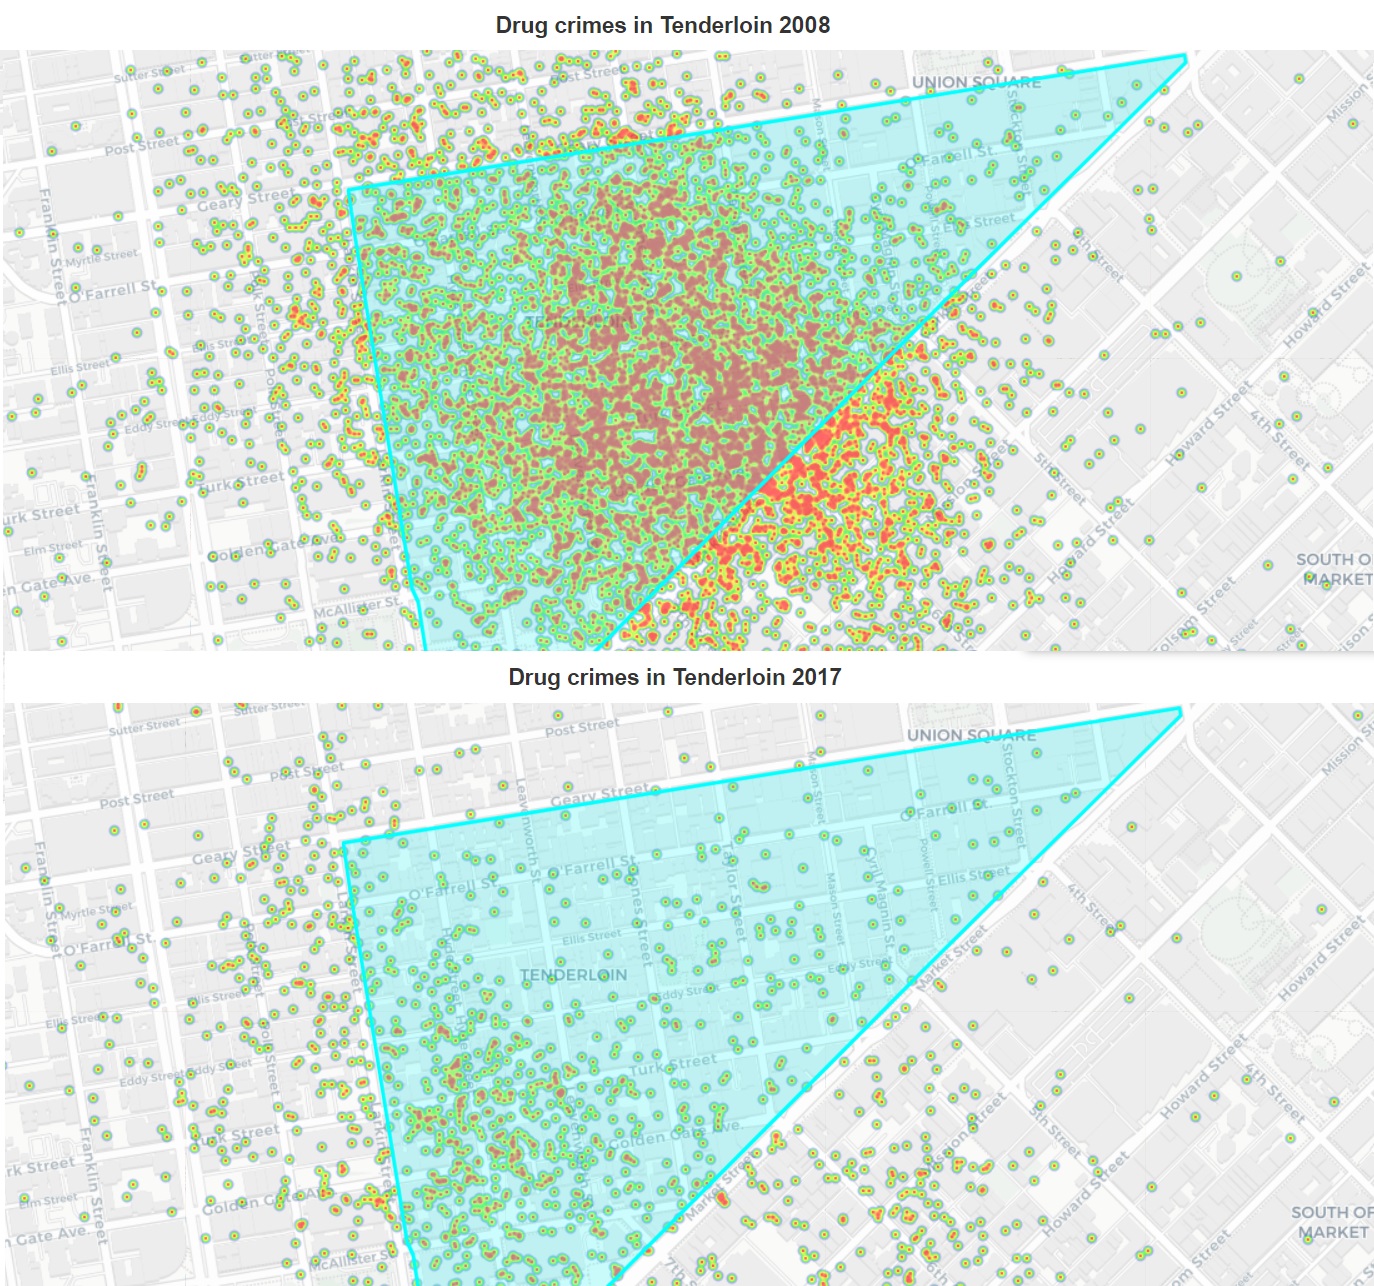 In 2008 the drug incidents were just everywhere and at a large scale. A lot has happened since then. The northern and eastern part of Tenderloin has been almost cleared for drug incidents. As wikipedia claims, the incidents now mostly happen on the infamous “Turk Street” and nearby. A full visualization over all the years can be seen here. Apparently, Turk Street has a history as a drug-infested street, and acts as a major drug hub in the city.
In order to further analyze the change over time, specifically in relation to the rest of SF, we choose to include a plot that demonstrate the quantile of drug incidents per area as it changes over time, as well as how the dayli occurences of incidents change. It is to be noted the area of Tenderloin is approximately 0.6 square kilometers.
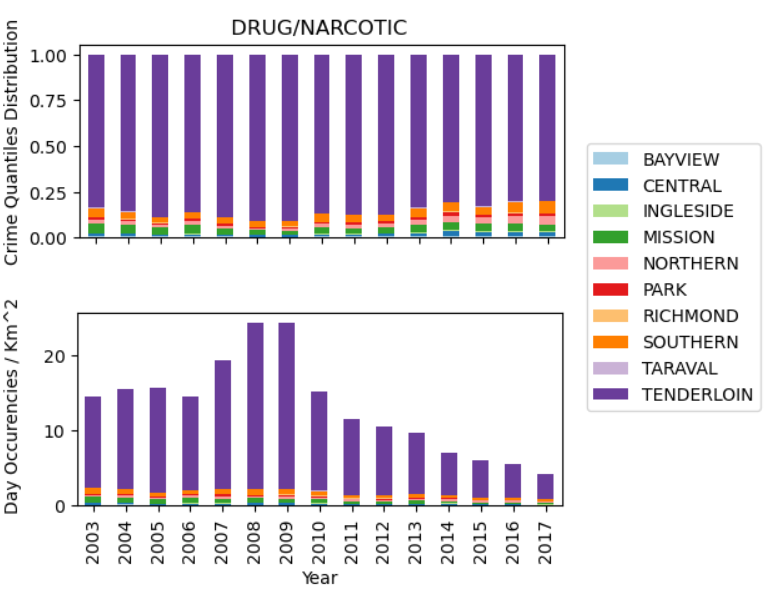
In 2008/2009 the drug incidents had generally been increasing for many years and were now at its highest all over SF, and particularly Tenderloin, with more than 20 occurences per day per square kilometer in Tenderloin. It has since dropped significantly all over and in Tenderloin to less than 4. This is a huge progress, as the heatmap also demonstrated. Not only that, Tenderloin has been making relative progress compared to the rest of SF.
Conclusion
In this article we have explored the crime history from 2003 to 2017 of the poorest district of San Francisco: Tenderloin. We have seen that the drug incidents in Tenderloin are particularly high, but that the drug incidents have been decreasing since 2008 over time, specifically in the Northern and Eastern part of the district. In addition, we have seen that the drug incidents in Tenderloin have been decreasing relative to the rest of SF.